Wednesday, October 31, 2007

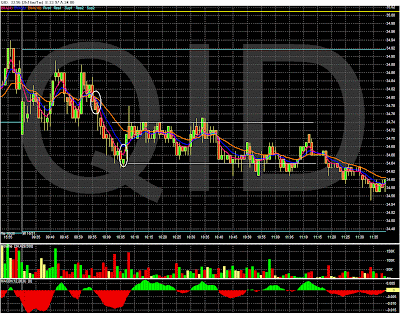
QID Trades 10-31-07


TRADE SUMMARY:
Trade Symbol L/S Enter Time Exit Time Profit Shrs Gross Profit
1 QID Short $34.77 9:56 $34.65 10:06 $ 0.12 500 $60
2 QID Short $34.59 11:50 $34.47 12:06 $ 0.12 500 $60
3 QID Long $34.54 12:28 $34.58 12:51 $ 0.04 500 $20
4 QID Long $34.60 12:52 $34.64 13:01 $ 0.04 500 $20
5 QID Long $34.61 13:50 $34.66 13:55 $ 0.05 500 $25
6 QID Short $34.67 14:41 $34.22 15:13 $ 0.45 500 $225


$410


Trade Symbol L/S Enter Time Exit Time Profit Shrs Gross Profit
1 QID Short $34.77 9:56 $34.65 10:06 $ 0.12 1000 $120
2 QID Short $34.59 11:50 $34.47 12:06 $ 0.12 1000 $120
3 QID Long $34.54 12:28 $34.58 12:51 $ 0.04 1000 $40
4 QID Long $34.60 12:52 $34.64 13:01 $ 0.04 1000 $40
5 QID Long $34.61 13:50 $34.66 13:55 $ 0.05 1000 $50
6 QID Short $34.67 14:41 $34.22 15:13 $ 0.45 1000 $450


$820


Trade Symbol L/S Enter Time Exit Time Profit Shrs Gross Profit
1 QID Short $34.77 9:56 $34.65 10:06 $ 0.12 1500 $180
2 QID Short $34.59 11:50 $34.47 12:06 $ 0.12 1500 $180
3 QID Long $34.54 12:28 $34.58 12:51 $ 0.04 1500 $60
4 QID Long $34.60 12:52 $34.64 13:01 $ 0.04 1500 $60
5 QID Long $34.61 13:50 $34.66 13:55 $ 0.05 1500 $75
6 QID Short $34.67 14:41 $34.22 15:13 $ 0.45 1500 $675


$1,230

Market Summary 10-31-07

Index Last Change % Chg
DJ Industrials 13930.01 137.54 1.00%
Nasdaq Comp 2859.12 42.41 1.51%
S&P 500 1549.38 18.36 1.20%
DJ Wilshire 5K 15673.36 191.35 1.24%
Russell 2000 828.02 11.87 1.45%
Nasdaq 100 2238.98 31.37 1.42%

Issues NYSE Nasdaq Amex
Advancing 2,415 1,996 854
Declining 887 1,017 386
Unchanged 85 110 98
New 52 Wk High 269 121 108
New 52 Wk Low 60 97 23
Total Volume 1,543,011,810 2,504,556,588 42,166,457
Advancing Vol 1,207,468,190 1,847,114,725 27,951,300
Declining Vol 325,086,120 629,273,400 10,440,457
Unchanged Vol 10,457,500 28,168,463 3,774,700

Futures Last Change
Crude Oil 95.19 0.66
Natural Gas 8.439 0.109
Gold, Dec. 799 3.7

From Briefing.com:
Moving the Market Sector Watch
Fed cuts policy rates by 25 basis points, leaving the fed funds and discount rates at 4.5% and 5.0% respectively

Q3 GDP rises to 3.9% (3.1% consensus)

Energy sector rallies in conjunction with crude prices following bullish energy report
Strong: gold; fertilizer & agriculture chemicals; health care distributors; education services; oil & gas exploration; home entertainment software; oil & gas drilling; systems software; tires & rubber; residential REITs

Weak: homebuilding; general merchandise stores; auto parts & equipment; department stores


Stock market bulls did their thing again on Wednesday, driving the indices higher on encouraging economic news, a batch of reassuring earnings results, and a decision by the Federal Open Market Committee to cut the fed funds and discount rates by 25 basis points each to 4.50 percent and 5.00 percent, respectively.

The FOMC decision wasn't heard until 2:15 pm ET. Prior to that, the market traded with a bullish bias, supported by the government's advanced report that third quarter GDP grew at an annualized rate of 3.9 percent.

The third quarter growth was remarkable when taking into account the subprime fallout, the housing industry downturn, and credit market crisis that highlighted the July to September period. Residential construction, in fact, took a full 1.1 percent off GDP growth. Offsetting gains, though, in consumer spending, business investment, government spending, inventories, net exports and nonresidential construction kept the U.S. economy on a noteworthy growth trajectory.

While fourth quarter GDP is expected by Briefing.com to slow to a pace closer to 1.5 percent to 2.0 percent, the market still walked away from the third quarter GDP report with a sense of comfort that consumer spending and business investment are solid enough to keep the economy out of recession.

The latter consideration, combined with reassuring earnings results and/or guidance from the likes of Mastercard (MA 189.91, +32.76), Transocean (RIG 119.37, +4.50), Clorox (CLX 62.57, +1.57), Kraft (KFT 33.41, +0.81) and Weyerhauser (WY 75.91, +1.60), put the market on a bullish course to begin the session.

Once again, stocks traded higher in the face of a spike in oil prices that followed another government report that showed a surprising 3.89 million barrel decline in crude stockpiles versus the market's expectation for a build of 400,000 barrels. Crude for December delivery, which dropped 3.4 percent on Tuesday after Goldman Sachs said to take profits, surged 4.6 percent to $94.53 per barrel on supply concerns entering the winter heating season.

The boost in crude prices gave a hefty lift to the energy sector (+1.8 percent) which was one of Wednesday's best-performing areas. It was the materials sector (+2.5 percent) that led all comers as strong earnings results from companies like Weyerhauser and Newmont Mining (NEM 50.90, +4.46), and a weak dollar, drove buying interest in the stocks of companies that stand to benefit from rising commodity prices.

The dollar index slipped 0.4 percent to 76.479 in the wake of the Fed's decision to cut interest rates.

In typical fashion, the FOMC decision led to some volatile trading shortly after the decision crossed the wires at 2:15 pm ET. Just prior to the release, the Dow, Nasdaq and S&P were up 53, 16 and 8 points, respectively. Within minutes of the FOMC's announcement, though, they were all showing slight losses.

The knee-jerk selling interest occurred in response to a directive from the FOMC that implied the rate-setting committee is reluctant to cut rates again. That understanding was driven by three items in particular: (1) the committee judging the upside risks to inflation roughly balance the downside risks to growth (2) the acknowledgment that recent increases in energy and commodity prices may put renewed upward pressure on inflation and (3) the indication that Kansas City Fed President Hoenig voted against a rate cut, saying he preferred no change in the fed funds rate.

With added time to examine the statement, the stock market got back into rally-mode driven by the takeaway that the FOMC might be reluctant to cut rates right now, but that it would ultimately do so if need be.

Fittingly, the financial sector (+0.8 percent) played an influential part in driving the late-afternoon rally effort, yet it still underperformed the broader market in Wednesday's trading.

All ten economic sectors closed with a gain. The technology sector (+1.7 percent), paced by ongoing strength in big-cap leaders like Google (GOOG 707.00, +12.23) and Microsoft (MSFT 36.81, +1.24), maintained its leadership role.

The Treasury market, meanwhile, was knocked on its heels by the stock market rally and the Fed's talk about the potential for renewed upward pressures on inflation. The 10-year note slipped 21 ticks, bringing its yield up to 4.46 percent.

ETFs Volume >1M and Gainers/Losers

Sorted by Price % Chg

Ticker Volume Vol. 3M Avg Vol % Chg Price %Chg
USO 6,366,200 2,836,230 124% 5.36%
UNG 2,250,700 1,671,370 35% 4.73%
INP 1,320,702 772,517 71% 4.33%
GDX 4,775,027 1,967,630 143% 3.65%
EWC 1,251,470 976,621 28% 3.65%
EWY 4,301,300 2,908,340 48% 3.47%
FXI 6,214,200 4,532,680 37% 3.35%
PGJ 2,503,952 1,110,410 125% 3.25%
QLD 3,310,745 2,396,570 38% 3.13%
EWZ 14,506,400 14,496,800 0% 2.95%
EWS 3,168,200 4,002,780 -21% 2.74%
XLE 29,285,090 22,365,400 31% 2.69%
XLB 9,645,243 8,462,860 14% 2.64%
EWA 1,997,616 1,862,980 7% 2.57%
OIH 10,548,400 9,071,140 16% 2.45%
SSO 2,091,305 1,304,000 60% 2.27%
EEM 21,106,800 16,526,800 28% 2.19%
EWM 1,665,900 2,737,170 -39% 2.02%
EWT 7,571,500 9,155,500 -17% 1.85%
IYR 5,673,500 6,382,050 -11% 1.80%
MDY 7,373,947 6,296,930 17% 1.76%
IWN 3,148,090 2,570,720 22% 1.70%
GLD 8,874,100 7,117,980 25% 1.64%
IWO 4,642,284 4,404,170 5% 1.64%
IAI 1,020,800 2,344,330 -56% 1.61%
ICF 1,195,300 828,577 44% 1.59%
EWH 14,767,100 6,513,190 127% 1.48%
QQQQ 148,431,832 143,584,000 3% 1.42%
EFA 8,751,366 7,407,730 18% 1.41%
XLF 84,949,120 64,537,700 32% 1.35%
IWM 107,684,138 103,818,000 4% 1.29%
IJR 3,392,200 2,176,050 56% 1.27%
IVV 3,686,416 2,928,330 26% 1.25%
XLK 3,877,486 3,457,160 12% 1.18%
IYT 1,066,200 777,336 37% 1.18%
SMH 10,340,300 10,962,500 -6% 1.17%
XLU 5,754,763 6,859,980 -16% 1.17%
IWD 1,403,400 1,665,730 -16% 1.12%
SPY 220,954,386 201,943,000 9% 1.04%
OEF 2,366,412 1,560,980 52% 1.00%
IWF 2,185,901 2,681,890 -18% 0.92%
XLI 5,443,388 5,472,140 -1% 0.87%
DIA 19,378,866 16,410,800 18% 0.82%
EWJ 13,485,000 21,288,700 -37% 0.70%
XLP 2,189,395 2,925,250 -25% 0.64%
XLV 1,654,539 2,002,310 -17% 0.61%
KRE 3,178,236 1,640,120 94% 0.60%
KBE 1,547,100 1,121,030 38% 0.59%
EWW 3,861,983 3,864,600 0% 0.54%
XRT 2,204,100 1,903,410 16% 0.36%
XLY 3,704,848 4,117,250 -10% 0.30%
RTH 6,998,200 5,614,410 25% -0.02%
SKF 1,285,960 781,244 65% -0.71%
TLT 2,498,481 1,957,620 28% -0.90%
DXD 4,429,045 3,550,800 25% -1.18%
SDS 19,836,131 15,666,000 27% -2.25%
TWM 5,825,722 3,639,380 60% -2.52%
ITB 1,957,000 630,077 211% -2.52%
QID 34,301,999 28,290,100 21% -2.74%
XHB 7,698,055 5,335,110 44% -3.19%
DUG 2,220,442 351,008 533% -3.91%

COMMENTS:
USO - Oil reversed direction from yesterdays drop and closed at record high over $94 and is now up over $95 in after hours. DUG, the oil and gas ultrashort became today's biggest loser, but its volume surges 553% over its 3 month average. People are placing their short bets.

INP - India's surge is 3 days strong now...its up 11.5% since last Friday's close

GDX & GLD - Gold prices are closing in on $800/oz. How do we reconcile record oil, gold and other commodity prices with a surging stock market? Seems like one of these market's will have to correct.

EWC - Canadian dollar continues to appreciate against the USD and Canada is a major gold, oil and mining play.

FXI & PGJ - China rolls on...

QQQQ & QLD - Big cap tech Nasdaq 100 continues to roll on...


When will the party end? Seems like there is a disconnect here...

Tuesday, October 30, 2007


TRADE SUMMARY:
Tough day today...no easy trades!!

Trade Symbol L/S Enter Time Exit Time Profit Shrs Gross Profit
1 QID Long $ 35.15 9:56 35.35 10:10 $ 0.20 500 $100
2 QID Short $ 35.29 10:13 35.11 10:40 $ 0.18 500 $90
3 QID Long 35.05 11:01 35.06 11:14 $ 0.01 500 $5
4 QID Long 35.05 11:26 35.1 11:34 $ 0.05 500 $25
5 QID Short 34.68 15:14 34.6 15:21 $ 0.08 500 $40
6 QID Long $ 34.66 15:34 34.81 15:50 $ 0.15 500 $75


$335


Trade Symbol
Enter Time Exit Time Profit Shrs Gross Profit
1 QID Long $ 35.15 9:56 35.35 10:10 $ 0.20 1000 $200
2 QID Short 35.29 10:13 35.11 10:40 $ 0.18 1000 $180
3 QID Long 35.05 11:01 35.06 11:14 $ 0.01 1000 $10
4 QID Long 35.05 11:26 35.1 11:34 $ 0.05 1000 $50
5 QID Short 34.68 15:14 34.6 15:21 $ 0.08 1000 $80
6 QID Long 34.66 15:34 34.81 15:50 $ 0.15 1000 $150


$670


Trade Symbol
Enter Time Exit Time Profit Shrs Gross Profit
1 QID Long $ 35.15 9:56 35.35 10:10 $ 0.20 1500 $300
2 QID Short $ 35.29 10:13 35.11 10:40 $ 0.18 1500 $270
3 QID Long $ 35.05 11:01 35.06 11:14 $ 0.01 1500 $15
4 QID Long 35.05 11:26 35.1 11:34 $ 0.05 1500 $75
5 QID Short 34.68 15:14 34.6 15:21 $ 0.08 1500 $120
6 QID Long 34.66 15:34 34.81 15:50 $ 0.15 1500 $225


$1,005

ETFs Volume >1M and Gainers/Losers

Sorted by % Price Change

Ticker Volume Vol 3M Avg Vol %Chg Price %Chg
DUG 1,405,544 303,134 364% 7.32%
TWM 3,936,088 3,601,540 9% 1.84%
XHB 5,299,900 5,273,640 0% 1.78%
SDS 7,742,533 15,723,900 -51% 1.50%
DXD 1,969,917 3,560,290 -45% 1.26%
IYR 3,565,400 6,493,210 -45% 0.45%
SMH 8,321,500 11,034,200 -25% 0.20%
QQQQ 114,561,903 144,308,000 -21% 0.18%
XLK 2,732,532 3,433,780 -20% 0.18%
XLU 3,507,008 7,006,920 -50% 0.12%
UNG 1,804,264 1,644,340 10% 0.07%
QLD 2,324,330 2,398,220 -3% 0.02%
TLT 1,439,600 1,954,900 -26% -0.06%
XLV 1,220,650 2,035,200 -40% -0.11%
IWF 1,946,800 2,691,500 -28% -0.13%
EWM 1,225,700 2,775,370 -56% -0.23%
RTH 3,453,200 5,600,880 -38% -0.30%
XLY 1,960,700 4,147,880 -53% -0.30%
KRE 2,366,571 1,595,220 48% -0.33%
QID 20,061,101 28,263,200 -29% -0.37%
XLP 1,541,980 2,929,740 -47% -0.42%
EWJ 10,218,800 21,995,200 -54% -0.49%
DIA 8,530,034 16,585,300 -49% -0.60%
SPY 132,923,616 203,969,000 -35% -0.69%
IVV 1,889,217 3,039,080 -38% -0.76%
IWD 1,008,400 1,686,820 -40% -0.77%
MDY 2,977,900 6,361,290 -53% -0.78%
IWM 59,940,622 105,130,000 -43% -0.79%
EFA 8,305,400 7,397,420 12% -0.79%
IJR 1,884,200 2,156,210 -13% -0.82%
XLI 2,207,283 5,541,810 -60% -0.89%
GLD 5,608,200 7,051,570 -20% -0.99%
IWN 2,336,300 2,561,110 -9% -0.99%
IWO 3,165,900 4,413,100 -28% -1.03%
IAI 1,023,800 2,401,390 -57% -1.12%
EWA 1,789,700 1,851,600 -3% -1.40%
EWZ 8,782,200 14,590,700 -40% -1.53%
XLF 28,533,810 65,085,700 -56% -1.54%
EWW 3,584,100 3,893,300 -8% -1.77%
FXI 3,399,730 4,501,940 -24% -1.80%
EEM 12,307,300 16,525,600 -26% -1.89%
EWS 2,810,700 4,032,410 -30% -1.92%
EWT 5,983,100 9,256,820 -35% -2.03%
GDX 1,304,845 1,922,860 -32% -2.05%
EWH 9,349,120 6,297,190 48% -2.16%
PGJ 1,922,655 1,065,120 81% -2.17%
XLB 14,756,646 8,333,170 77% -2.35%
EWY 3,035,800 2,880,220 5% -2.58%
XLE 24,769,569 22,376,300 11% -3.40%
USO 4,123,500 2,747,320 50% -4.08%
OIH 9,092,900 9,084,400 0% -4.09%

COMMENTS: Goldman says its time to get short oil via DUG or shorting OIH, XLE or USO. Shorting the Russell 2000 may not a bad idea either via TWM (recall Biderman yesterday).